Panobi Review | The Platform for Growth

Article written by
Stuart Brameld

Note: In early May 2024 the cofounders of Panobi announced they would be closing down the company.
I'm sorry to say that we're closing down Panobi. Early stage startups are high risk bets, and we lost this one. 💔 💜
Similar to our GrowthHackers Projects, Truenorth.io and UpGrow review this article is an in-depth review and analysis of the Panobi growth platform. We’ll start by highlighting some of the pros and cons but go into far more detail throughout the article.
Information is correct as of April 2024. Growth Method has made every attempt to ensure the accuracy and reliability of the information provided below.

Pros
Here are the main benefits for the Panobi platform:
Less work about work, more outcomes less outputs
Ability to connect company goals to daily work
Understand the impact of projects with metrics
Ideally suited to product/SaaS growth teams
Seamless integration with feature flag services such as LaunchDarkly, Statsig and Split.io
Heavily data oriented - store all data from all sources
Inbuilt charts include time-series, line, area, column, bar and scatter charts
Cons
Where we feel Panobi is less strong:
Heavy focus on developers and engineers
Built for software businesses and product growth teams rather than growth marketing teams
Works best with a data warehouse integration
Most integrations are to connect with product feature flag services
Whilst viewer accounts are free, they still require accounts creating manually
Pricing plans limits metrics and integrations
No enforced experiment time
Custom integrations only available on the Enterprise plan
Metrics data is not stored in-app, deleting a metric also deletes all associated data
A complete though complex UI for new users - activity feeds, notifications preferences, target audiences, tags, custom project fields etc
What is Panobi?
Panobi have pivoted from their previous messaging as a growth observability tool and growth-tracking platform in 2023. Today Panobi describe themselves as a "platform for growth" by bringing experiments, metrics and reporting together all into one place.
https://www.youtube.com/watch?v=lOsnotgtFYQ
Panobi brings work streams into a single, automated view by integrating with existing systems like data warehouses and product experimentation tools so that everyone at a company can see what the growth team is working on, what its goals are, and how it’s performing against those goals – regardless of whether the growth team primarily works on marketing/demand gen, activation, paid conversion or on the entire funnel.
https://panobi.com/post/announcing-panobi
Whilst the target audience includes marketing, demand generation, activation and paid conversion the current version is heavily geared towards product experimentation and product growth teams in SaaS businesses with using PLG as their primary go-to-market strategy.
Who is behind Panobi?
Panobi was founded by Merci Grace and Jason Klym.
Merci was the Head of Growth at Slack between 2015 and 2017, before joining Lightspeed Venture Partners as a Partner in 2018 to 2020. Merci founded Panobi with Jason in October 2021.
Jason worked at SAP and Amazon as a software developer before joining Slack in 2015 where we was promoted to Senior Staff Engineer in mid 2021 before leaving to start Panobi with Merci.
Panobi raised a $5million seed round from Index Ventures, a European venture capital firm with dual headquarters in San Francisco and London. The fundraise included participation from Stewart Butterfield (ex Slack), Cal Henderson (ex Slack), April Underwood (Zillow), Jana Messerschmidt (#ANGELS), Lenny Rachitsky (ex AirBnB), and Fareed Mosavat (ex Slack, now at Reforge). According to PitchBook Panobi has raised $10M to-date with 2 separate seed fundraising rounds.
Panobi is headquartered in San Francisco, California.
Panobi Features
Here are some of the core features of the Panobi platform.
1 Timeline
The Panobi timeline view enables you to see experimentation results and KPI data alongside product and marketing efforts.
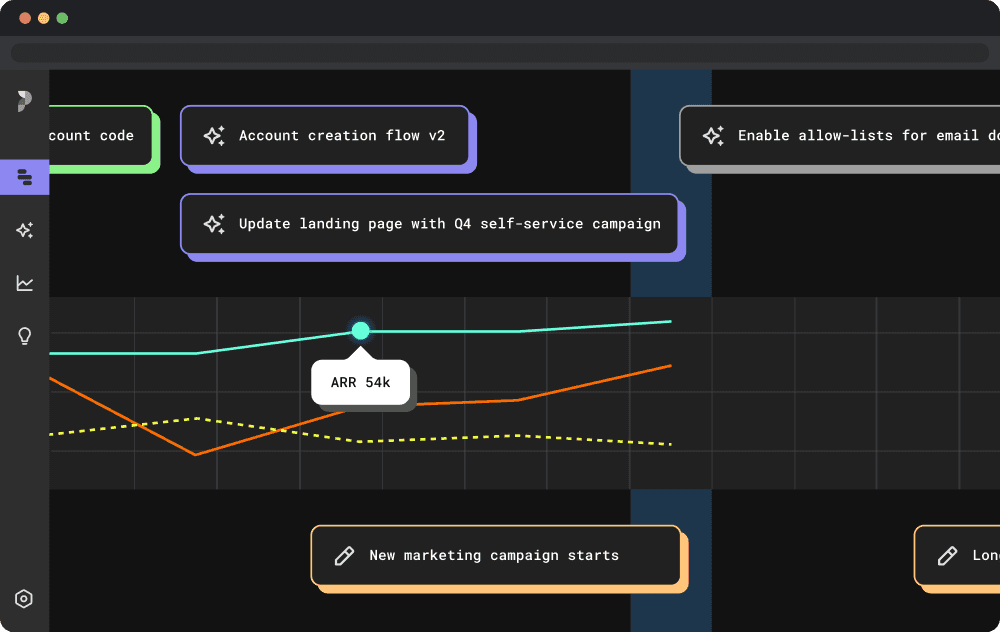
This helps growth teams to communicate strategy and to execute on tactics at the same time, without requiring screenshots, spreadsheets and copy/paste. See what everyone is working on at a glance and tie your daily work to the wider growth strategy.
For more information see https://panobi.com/features#feat-timeline and https://help.panobi.com/en/articles/8196217-see-the-big-picture-with-your-timeline
2 Projects
A project is any discrete block of work that your team works on: major and minor projects, experiments, and tests of all sizes. You can track everything your team does and ships - from A/B tests, onboarding and invites - using the rich text editor.

Panobi makes it easy to see at a glance what's live, what's coming up next, and what's waiting in the backlog. Projects also provides the opportunity to go back in 12 months time and remember what things looked like before - kind of like your teams' own Wayback Machine.
Use Panobis quick add feature to quickly capture ideas from anywhere in the platform without interrupting an existing meeting or discussion.
3 Idea Prioritisation
Get everyone aligned on priorities using the built-in RICE calculator based on the RICE scoring framework. Once prioritised every ideas get a priority score from 1 to 100.

More more information see https://help.panobi.com/en/articles/8196665-prioritize-your-backlog-with-rice-scoring.
3 Reporting
One of the core tenants of the Panobi platform is to enable your team to tell better stories and to share consistent updates across your company. Panobi uses AI technology to help you write your weekly report which details:
Completed - what was completed last week
Upcoming - what's upcoming for the next week
Metrics - week over week changes to your core metrics
Users can add additional content or comments before saving and publishing the report.
For more information see https://panobi.com/post/tell-a-stronger-story & https://help.panobi.com/en/articles/8265449-automated-reports-are-your-superpower
Panobi metrics & integrations
The Panobi growth platform integrations with a wide variety of software platforms, a full list has been included below which is correct at the time of writing.
LaunchDarkly: Feature Flags, https://help.panobi.com/en/articles/8250753-integrate-with-launchdarkly
Statsig: Feature Flags, https://help.panobi.com/en/articles/8250800-integrate-with-statsig
Split: Feature Flags, https://help.panobi.com/en/articles/8250793-integrate-with-split
Feature Flag SDK: Feature Flags, https://help.panobi.com/en/articles/8251172-integrate-with-an-internal-feature-flag-system-feature-flag-sdk
AB Tasty (Flagship): Feature Flags, https://help.panobi.com/en/articles/8451835-integrate-with-ab-tasty-flagship
Snowflake: Data warehouse, https://help.panobi.com/en/articles/8234936-integrate-with-snowflake
Redshift: Data warehouse, https://help.panobi.com/en/articles/8234979-integrate-with-redshift
BigQuery: Data warehouse, https://help.panobi.com/en/articles/8235080-integrate-with-bigquery
Custom SDK: Data warehouse, https://help.panobi.com/en/articles/8251204-integrate-with-a-custom-data-source-metrics-sdk
Jira Cloud: Project Management, https://help.panobi.com/en/articles/8451833-integrate-with-jira-cloud
Asana: Project Management, https://help.panobi.com/en/articles/8451834-integrate-with-asana
Zapier: API Integration, https://zapier.com/apps/panobi/integrations & https://help.panobi.com/en/articles/8772411-integrate-with-zapier
Google Sheets: API Integration, https://help.panobi.com/en/articles/8802332-integrate-with-google-sheets https://panobi.com/post/google-sheets-integration
CSV Upload: File Upload
The preferred way to use Panobi is by integrating with your data warehouse and using that integration to pull in topline metrics (such as Weekly Active Users, Demo Conversion Rate, Monthly Recurring Revenue etc) using timeseries data.

Once an integration has been creating you can use a hash sign (#) in projects, comments and reports to search for and link/reference it so that readers know what you're trying to improve. If a metric has been mentioned in projects or insights, the "Mentioned in" section at the end of the metric's detailed view will show a list of these places, with links for quick viewing.
Panobi makes it easy to toggle between performance of metrics and experiment outcomes that your team cares about, whilst seeing impact on topline metrics and business metrics the exec team care about - helping to connect your daily work to the wider company growth strategy.
For more information see https://help.panobi.com/en/collections/5651195-for-developers, https://panobi.com/post/mention-your-metrics-with-the-ease-of-keystroke and https://help.panobi.com/en/articles/8196003-add-metrics.
Metrics & Integrations | Technical details
Only metrics configured with the time series chart type are available to display on your timeline, hence all KPI and OKR-level metrics should use the time series type. You can use and include other metrics to track such as baseline health indicators.
Live metrics require a data source integration and timeseries data to be sent in a specific format. The X-axis should include one independent variable, and must be date values (a calendar day). The day is effectively a unique key for a metric. The Y-axis should include one dependent variable and must be numeric data (float or integer value).
Timeseries data can be sent one item at a time or in batches of up to 1000 items
For timeseries metrics, the header row is optional and must be
MetricID,Date,Valueif present.Only new rows will be uploaded, existing rows will not be modified.
The following are examples of valid rows for standard metrics and timeseries metrics:
Metrics & Integrations | Project Management
Panobi is able to connect natively to Jira and Asana, and can map fields between them as per https://help.panobi.com/en/articles/8621977-connect-your-project-management-platform.
Once connected when adding a project in Panobi you select your project management integration from the dropdown and can select an issue or task to import.
For more information see https://help.panobi.com/en/articles/8451833-integrate-with-jira-cloud and https://help.panobi.com/en/articles/8451834-integrate-with-asana.
Panobi Pricing
At the time of writing Panobi has 3 pricing plans - Free, Pro and Enterprise - with a varying restrictions around usage as detailed below.
Free: Editors: 2 free editor seats, Viewers: Unlimited viewer seats, Metrics: Up to 5 metrics, Integrations: Up to 2 integrations, Auth: Google Auth
Pro: Editors: Up to 20 editor seats, Viewers: Unlimited viewer seats, Metrics: Unlimited metrics, Integrations: Unlimited integrations, Auth: Google Auth
Enterprise: Editors: Unlimited editors, Viewers: Unlimited viewer seats, Metrics: Unlimited metrics, Integrations: Unlimited integrations, Auth: Google Auth, SSO, SAML, 2FA + Role Management
Fore more information see https://panobi.com/pricing.
Panobi Alternatives
Below is a list of Panobi competitors and alternative software. You may also be interested in our marketing project management software review which includes more general project management software.
Effective Experiments: Document, Manage & Scale Your Experimentation Program
Growth Method: Growth Method is a growth marketing platform designed for experiment-led and data-driven marketers.
Growth.Software: Growth Software is an adaptable work management platform that collects data and measures the results of any initiative, creating a learning center for all your activities.
GrowthHackers Projects: A private community for top growth leaders - where marketing, product, and growth experts come to learn, connect, and tackle challenges together.
TrueNorth: TrueNorth is the only growth marketing platform to plan and track marketing in one place, with everything and everyone focused on the goal. Marketing works best when everyone can see what they’re working towards. Project your growth to align your team and marketing with the end goal.
UpGrow: The right way to keep track of your Growth Experiments
Final Thoughts
For mature growth teams in product organisations running frequent in-product experiments and that use a Snowflake, Redshift or Biquery data warehouse, Panobi is an excellent choice. We believe Growth Method will continue to better serve the growth marketing community.
To discuss this further and understand which growth tool is best suited to your organisation request a call with Stuart.
Further information
Some of the resources used in this review and listed below
Product experimentation best practises https://help.panobi.com/en/articles/8280506-product-experimentation-best-practices
Article written by
Stuart Brameld
Category:
Marketing Project Management